Search
BSA Membership Graph (1911 - 2023)
Stolen from Reddit.
The big drop in the 1970's was supposedly due to a change in the program to de-emphasize outdoor activities. The step down in 2019 was the LDS church cutting ties and starting their own program.
If you consider this as a proportion of the population it's an even bigger drop. In 1970 there were about 4.8M scouts in a population of 205M, so about 2.3% of all Americans were in Boy Scouts. Now it's 1M scouts in a population of 341M, so only 0.3% of Americans are in Boy Scouts.
▶️ Total olympic medals won in Paris 2024 and Human Development Index 🏅
▶️ Total olympic medals won in Paris 2024 and Human Development Index 🏅
➡️ https://www.businesstimes.com.sg/opinion-features/what-olympic-medal-table-really-tells-us
After reading the article we made this #boxplot using #LabPlot, an open source data analysis and visualization software.
The plot doesn't provide answers, it rather invites some thinking.
\#Olympics #Olympics2024 #France #China #USA #UnitedStates #UnitedKingdom #UK #Brazil #Australia #Japan #Italy #Canada #Germany #Italy #Netherlands #DataAnalysis #DataScience #OpenSource #FOSS
"Did Not Vote" won 11 of the 12 last U.S. Presidential Elections
Graph via Data is Beautiful on Reddit
Ages of women in 'Mambo No. 5', between 1999 and 2023
Source: https://www.reddit.com/r/dataisbeautiful/comments/1e7cy2x/mambo_no_5_was_released_25_years_ago_how_have_the/
Source OP's comment:
>Source: birth rates in the US, from social security card applications. Provided by SSA.gov. For the age ranges, we make the assumption that all women lived to exactly 73 years old, which is the life expectancy for females at birth in 1960. Therefore, the population in each age range will not be entirely accurate, particularly for 69+, but it nonetheless shows the trends of birth rates and popularity of these names over time. Tools: python, pandas, Vega>

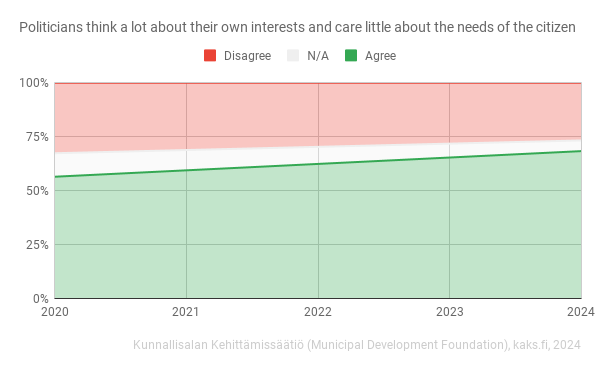
Politicians think a lot about their own interests and care little about the public
https://web.archive.org/web/20240518061606/https://kaks.fi/wp-content/uploads/2024/05/tutkimusosio-18052024.pdf
Finland dataset
Edit: final update for the viz, comments started with this
Life expectancy vs healthcare spending of US compared to other developed countries
Americans have a lower life expectancy than people in other rich countries despite paying much more for healthcare. What factors may explain this?
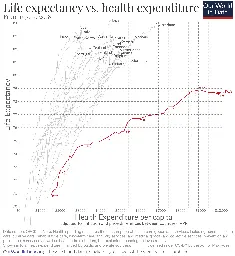
cross-posted from: https://lemmit.online/post/2699114
> Life expectancy vs healthcare spending of US compared to other developed countries > > ##### This is an automated archive made by the Lemmit Bot. > The original was posted on /r/dataisbeautiful by /u/dolekanteel on 2024-04-18 15:57:43. >
Seven jurors have been selected (so far) for the Donald Trump "hush-money" trial. This is where those seven jurors get their news.
cross-posted from: https://lemmit.online/post/2699112
> ##### This is an automated archive made by the Lemmit Bot. > The original was posted on /r/dataisbeautiful by /u/JPAnalyst on 2024-04-18 15:16:16. >
US energy generation by source in various regions
The graphs are from the US Energy Information Administration's Hourly Electric Grid Monitor: https://www.eia.gov/electricity/gridmonitor/dashboard/electric_overview/US48/US48
The date format in the titles is month/day/year, but in the horizontal axes it's day-month-year. I apologize in advance.
The amount of work that once bought an hour of light now buys 51 years of it
The Washington Post article mentions a 1994 research paper by William Nordhaus as the source, but their link doesn't seem to work. Here's a working link to the paper: https://cowles.yale.edu/sites/default/files/2022-08/d1078.pdf
World's population at 8 billion people visualized
Source. There are other great visualizations of population sizes there.
Daily COVID-19 deaths per capita in Europe and US by region
The source article has more graphs and an overview of COVID numbers.
Looking for moderators.
Don't like making meta posts in image communities, but figured this one is important. I'm currently the only mod here and I've sadly had to be less active given sizable real life responsibilities. So posting here to see if anyone is up for assisting in mod management?
If anyone's interested just comment below and I can get things approved from there. Preferably say any experience you have if applicable.
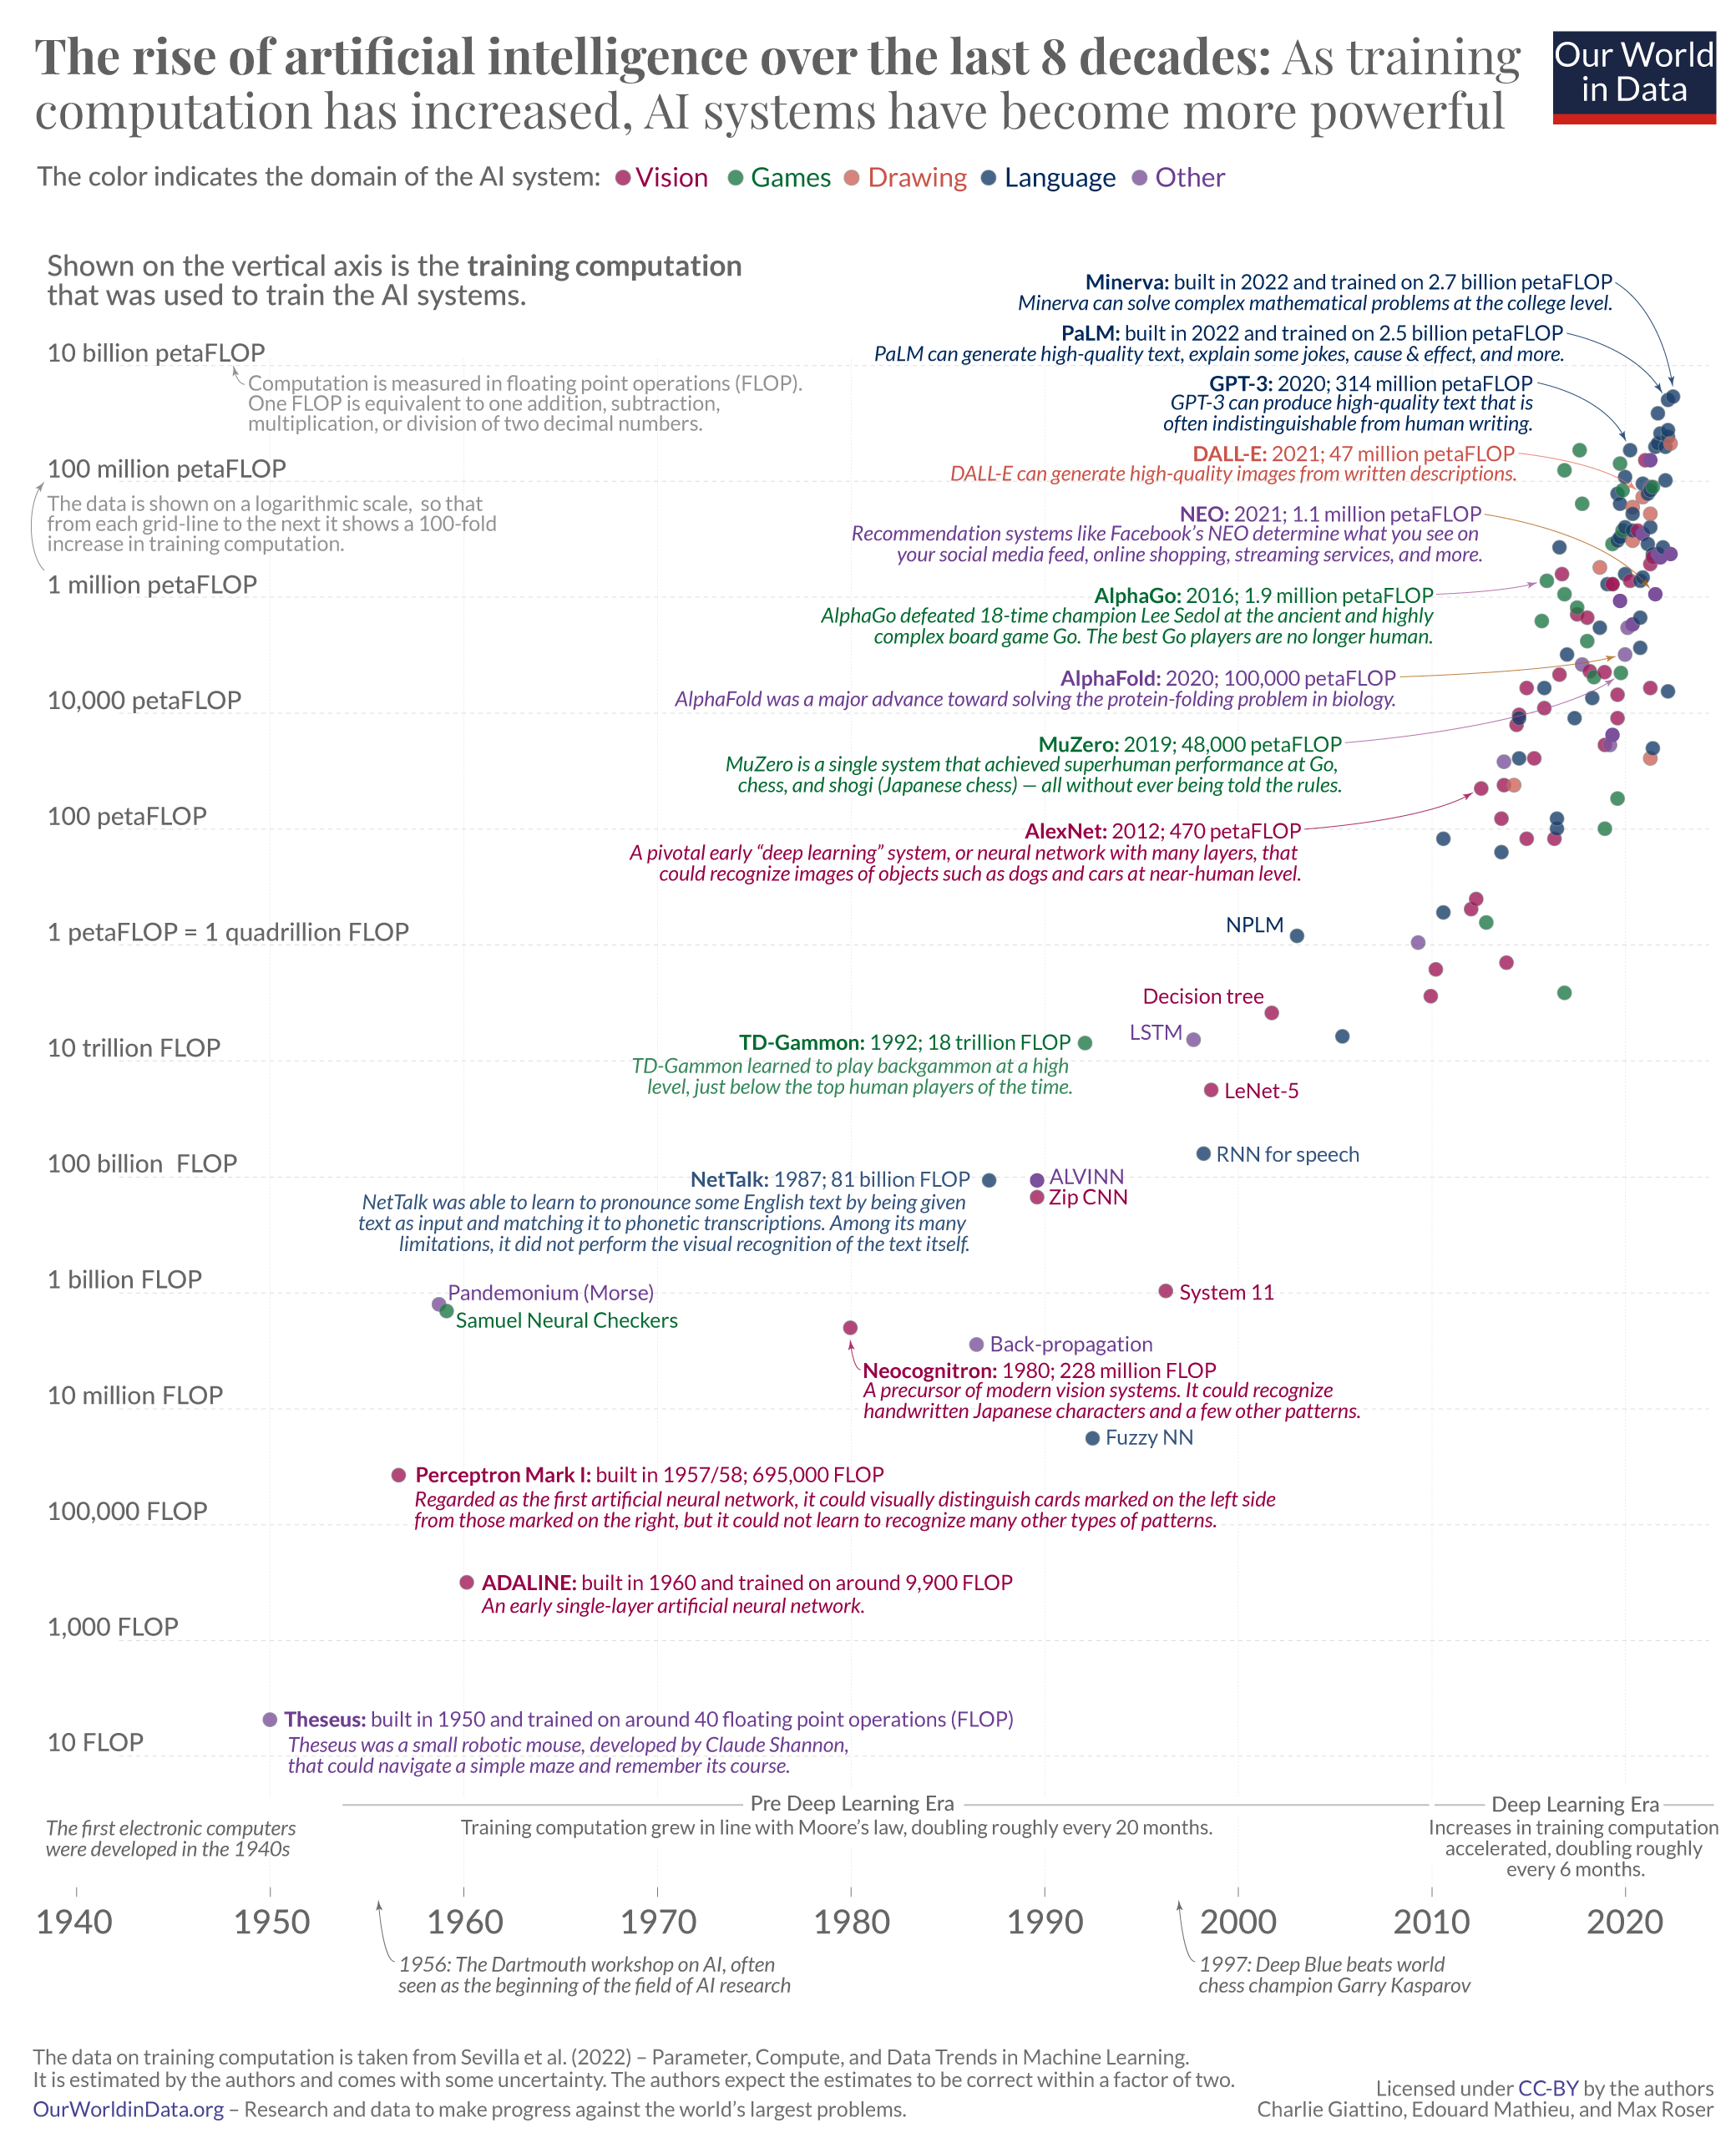
The Exponential Growth in AI Computation
In eight decades, artificial intelligence has moved from purview of science fiction to reality. Here’s a quick history of AI computation.


I wonder what cultural changes that kind of majority levels will provide.
I hope we get a new, better system out of it.


Came to make a smartass comment like "at least they'll grow out of it when they become adults, right???" but the more I stared at the chart and thought about what it was saying it started to hurt a bit.
I had a bad time largely growing up, and still to this day struggle a lot with depression. I'm front about the happiest time period on this chart.
I went and looked up the study, and there's over 40 pages of charts similar to this one. All the things about depression seem up, and participation in school, activities, and dating/sex/drugs are all down considerably. It doesn't sound like anything is better for kids.
I didn't have children, mostly due to the bad time I had, so I'm curious to go back and read the study, though I didnt see any obvious conclusions skimming through. I feel my perception of if things are bad today is skewed due to my issues, so is the world really worse these days, or is something else going on?
I suspect there is a correlation with tech adoption. This chart isn't the end-all-be-all, but it's a start. (The years aren't consistent on the attached chart, btw.)
How many people are entering the house?
In this case, it was three armed home intruders, plus a getaway driver.
Are they all Jason Bourne like fanatics who are willing to commit suicide in the process of killing you?
If they are, then you have done something seriously horrific and they are most likely justified in seeking your end.
...That's quite a stretch, don't you think? Bluntly, if anyone breaks into my home while I'm home, I'm going to assume that they're intent on causing harm to me, because I'm sure as shit not going to politely ask them to fill out a questionnaire before acting.
I guess you could technically argue that the linked article promotes an anti-gun stance so it could be labelled propaganda (though I suspect you mean something more specific than just promoting a political stance).
However the graph itself is just the raw data displayed nicely so it's hard to argue that's propaganda or misleading. The graph is a little out of date but you can verify the current data by checking the source listed, the only thing that isn't displayed publicly on that page is the subdivision of the now 27 instances where a bystander shot the attacker. Edit: This does also include knife and gun violence, though.
Your assertion that more guns would make the results "vastly different" isn't based in any evidence, while the counter-argument that stronger gun controls and less gun-centric culture prevents mass shootings can be clearly demonstrated by simply looking at literally any other country. According to Wikipedia there have been only 45 mass shooting deaths (including attackers) in total in the UK this century. When a shooting happens here it's always newsworthy.

I don't know much about long rifles. But Wikipedia at least defines AR-15s as "lightweight assault rifles". And the OP talked about AR-15s specifically.
I can see it getting hard to read.
A bystander subdued the attacker 42 times

Cops seem pretty jumpy
Come on, it's not like a cop would yell "SHOTS FIRED" because of a falling acorn and proceed to empty his clip, would it?
So in short, in the 433 cases, 12 of them is stop by good guy with gun and 42 of them is stop by good guy with massive balls.
So by the statistic provided we should give everyone massive balls instead of gun to stop gun violence.
Interesting. Hey, Jamie, overlay a map of indigenous populations...
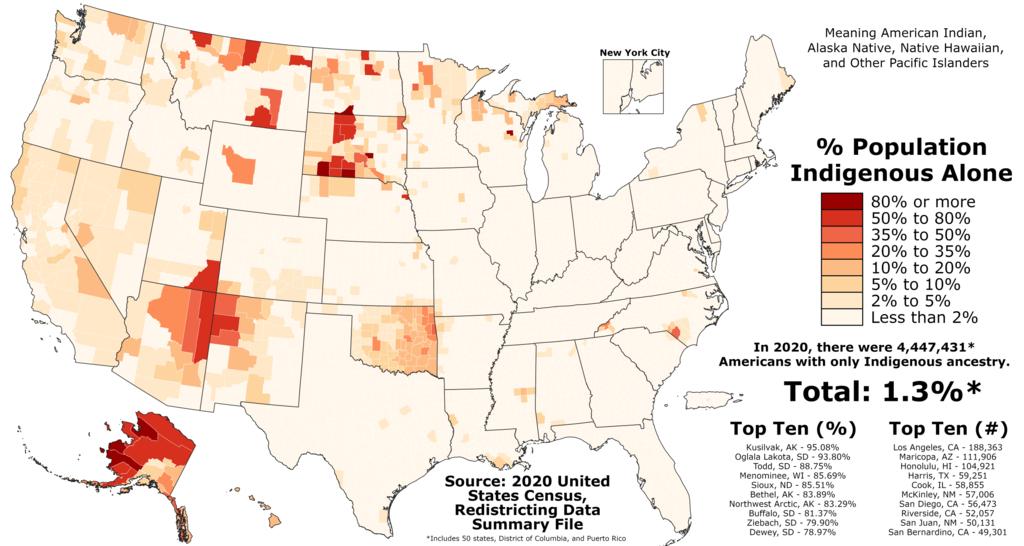
(Correlates less the further east and south you get, though)
The hardest working states are the ones right down the middle, from North Dakota to Texas. The least hardworking are generally the northeast (excepting the redder states of NH and ME) and west coast.
Somewhat unsurprising if you realize that most of the states down the middle have some of the lowest unemployment rates in the nation--e.g., North Dakota has an unemployment rate under 2%, whereas states like California, Washington, and New York have some of the highest.
Hardest working also factors in rates of overtime or multiple jobs (i.e., average hours worked per week), so realistically you want to be somewhere like Mass or Vermont (and others) that have both low unemployment and reasonable weekly hours.
That makes those states less "hardworking," but I would bet the standard of living/happiness indices are higher in those states. Regardless, by these metrics and in general, red states do work more hours and have more of their state's people gainfully employed.

It's basically where people exercise more and/or have an outdoors-y culture.
Levels of sedentary lifestyle by state:
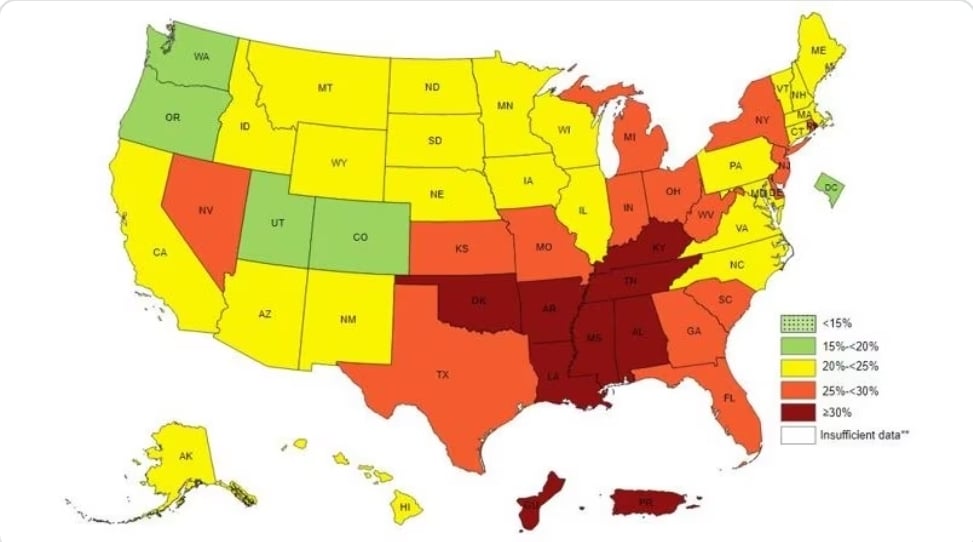
If that map was more granular, I bet it would match very closely.
Lazy ass Rhode Islanders.
I saw an explanation that this is effectively mapping White and Latino populations.
Which also led me to learn about the Hispanic Health Paradox, which was a very interesting read.
Trust the audience to be literate

But really, that depends on the intended audience.
If the difference is switching to cannabis, men do tend to be heavier users.
(Side note: one article I saw while looking for this referred to it as the "grass ceiling" lol)
As a non-drinker that seems like a lot, OTOH, I have spent a lot on liquor for cooking so...