It's definitely not a good trend ☹️
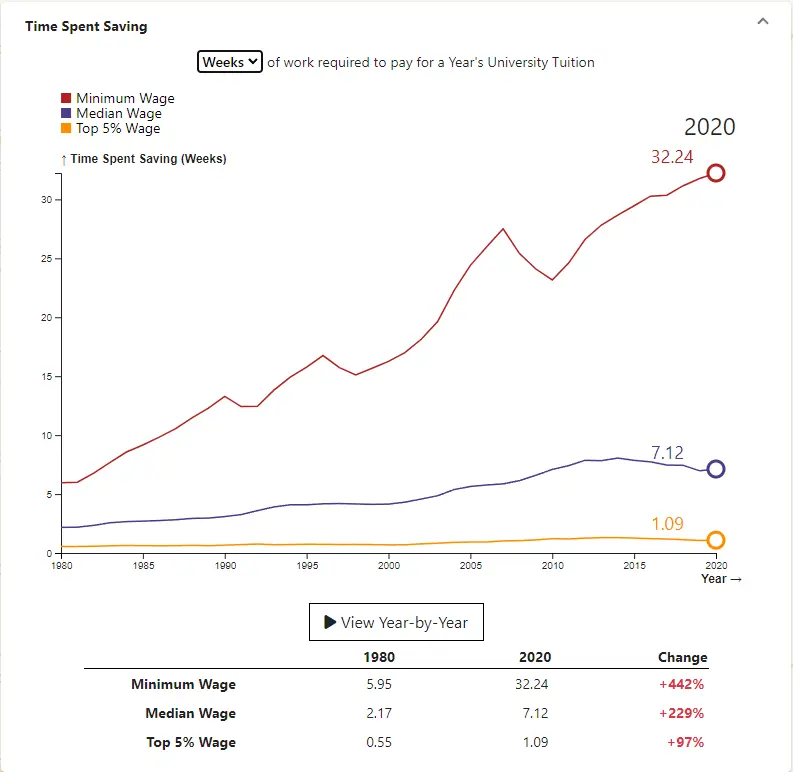
The minimum wage was raised in 2007, 2008, and 2009 to its present value of $7.25, so the amount of minimum wage required to save for tuition dropped at that time.
I added the wage data for each bracket to the OP for reference. I did have an error where I was dividing the Median and Top 5% annual wages by 40 instead of 52 to get the weekly wage. I fixed that and updated the OP. The average wage for the Top 5% in 2020 is $447,570 annually or $8,607 weekly, so for $16k tuition it would take 1.86 weeks of saving for a Top 5% earner. However the average tuition is $9349, so it would only take 1.09 weeks for a Top 5% earner to save that much.
It would be interesting to have a more region-specific breakdown of this information, especially since the U.S. is so big and costs (and minimum wages) vary widely from place to place. I haven't been able to find more granular data, though.
Hahaha, fair enough. I threw some axis labels on there.
The Amount of Work Required to Afford University Tuition (1980-2020)


Workers have to work for a longer period of time in order to afford University Tuition than they used to in 1980. The trend is hardest on minimum wage workers who have to work 32.24 weeks of full-time work in 2020 to afford tuition, compared to 5.95 weeks of full-time work in 1980. This ignores taxes and assumes all money earned is put toward tuition.
Since 1980 the price of a Year's University Tuition has increased by 282% when adjusted for inflation.
Wages have gone up nominally, but not as much when accounting for inflation. The minimum wage has decreased since 1980 after adjusting for inflation.
Sources:
- Median and Top 5% Income: Census.gov (Table H-3)
- Minimum Wage: Department of Labor
- Year's University Tuition: NCES (Public Universities)
Visualized on boomerchecker.com
Edit:
- Fixed an error when converting Median and Top 5% from annual to weekly. The time to save for those two brackets rose as a result.
- Added wage data for the different wage brackets for reference.