Search
Have you seen this video tutorial on how to extract plots, curves and data points from images using #LabPlot's Data Picker tool ?
Have you seen this video tutorial on how to extract plots, curves and data points from images using #LabPlot's Data Picker tool ?
Data Picker has been available in LabPlot since the version 2.2, but we renamed it recently to Data Extractor.
https://www.youtube.com/watch?v=D\_Pz5aA-4Xg
\#LabPlot #DataVisualization #PlotDigitizer #DataExtraction #DataExtractor #Plots #Graphs #FreeSoftware #OpenSource #FOSS #FLOSS
#LabPlot is currently fully available in British English, Catalan, Dutch, Galician, German, Polish, Slovenian, Spanish, Swedish and partially available in French, Italian, Ukrainian, Russian and other

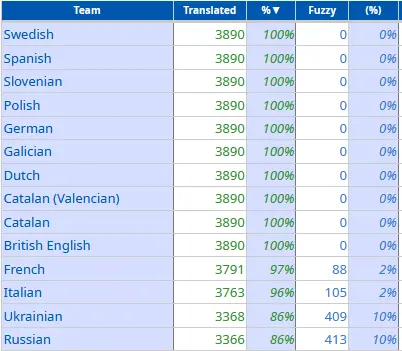
\#LabPlot is currently fully available in British English, Catalan, Dutch, Galician, German, Polish, Slovenian, Spanish, Swedish and partially available in French, Italian, Ukrainian, Russian and other languages.
We would like to thank all LabPlot's translators and encourage others to provide translations in other languages ❤️ 🙂
Check translation statistics: ▶️ https://l10n.kde.org/stats/gui/stable-kf5/package/labplot/
Please get involved! ▶️ https://community.kde.org/Get\_Involved/translation
This page contains a list of external resources mentioning #LabPlot and its usage in various areas 👨🔬 🔭 🔬 .

This page contains a list of external resources mentioning #LabPlot and its usage in various areas 👨🔬 🔭 🔬 .
➡️ https://labplot.kde.org/references/
If you are aware of other resources that could be listed there, please contact us.
\#LabPlot #Science #Research #Students #Physics #Medicine #Chemistry #Biology #Engineering #Ecology #Electronics #Robotics #Education #OpenSource #FreeSoftware
If you want to learn #statistics, we highly recommend this YouTube channel: #TileStats.
If you want to learn #statistics, we highly recommend this YouTube channel: #TileStats.
You can start with this Basic Statistics course: ➡️ https://www.youtube.com/watch?v=YZGG5PpbJdc&list=PLLTSM0eKjC2eSEO7y7MZWb1sdDJiAejoI
\#Students #DataAnalysis #DataScience #AI #MachineLearning #Teaching
An open access article by W. Morales González and J. E. Hernández-Ruiz: Experiencias en el uso del software LabPlot en el procesamiento analítico y gráfico de datos experimentales


An open access article by W. Morales González and J. E. Hernández-Ruiz: Experiencias en el uso del software LabPlot en el procesamiento analítico y gráfico de datos experimentales
\#LabPlot #Students #Research #DataAnalysis #Physics #DataVisualization #experimental #Física #Teaching #Chemistry #OpenSource #FreeSoftware
You can fit data to a statistical distribution in a flash using #LabPlot
Video
Click to view this content.
You can fit data to a statistical distribution in a flash using #LabPlot [dev 2.12 version]
➡️ https://invent.kde.org/education/labplot/-/merge\_requests/562
\#DataAnalysis #dataScience #data #Statistics #Research #Science #dataVisualization #Technology #Students #AlternativeTo #SciDavis #FreeSoftware #OpenSource
▶️ LabPlot - Tutorial - Stacked Plots
▶️ LabPlot - Tutorial - Stacked Plots
Catalyst Nanomaterials Lab has published another video tutorial that shows how to create stunning stacked plots in #LabPlot. Go check it out!
https://www.youtube.com/watch?v=rZ5qYjM8FEg
\#FreeSoftware #DataAnalysis #DataVisualization #Research #OriginProAlternative #Science #Tutorial #FLOSS #FOSS #OpenSource #StackedPlots #ProbabilityDistribution #AlternativeTo #KDE #Students #Researchers #Professionals #SciDavis #Technology
The #LabPlot team is already hard working on new features. Check out our growing list of the post-v2.11 development news! 🚀 🚀 🚀 Come join us! 🙂
The #LabPlot team is already hard working on new features. Check out our growing list of the post-v2.11 development news! 🚀 🚀 🚀 Come join us! 🙂
➡️ https://discuss.kde.org/t/labplot-post-v2-11-new-features-and-development-news/19467
\#FreeSoftware #DataAnalysis #Research #Science #FLOSS #FOSS #OpenSource #Business #AlternativeTo #KDE #Students #Researchers #Professionals #SciDavis #Technology #KDE
▶️ Como instalar o editor de plotagens de #LabPlot no #Linux via #Flatpak
▶️ Como instalar o editor de plotagens de #LabPlot no #Linux via #Flatpak
➡️ https://www.edivaldobrito.com.br/como-instalar-o-editor-de-plotagens-de-labplot-no-linux-via-flatpak
\#FreeSoftware #DataAnalysis #Research #OriginProAlternative #Science #Tutorial #FLOSS #FOSS #OpenSource #Business #AlternativeTo #KDE #Students #Researchers #Professionals #SciDavis #Technology
▶️ LabPlot - A free OriginPro alternative for Researchers (Distribution Plots)
▶️ LabPlot - A free OriginPro alternative for Researchers (Distribution Plots)
Catalyst Nanomaterials Lab has published another video tutorial that shows how to create stunning distribution plots in #LabPlot. Go check it out!
➡️ https://www.youtube.com/watch?v=grnKnbPIgz8
\#FreeSoftware #DataAnalysis #DataViz #Research #OriginProAlternative #Science #Tutorial #FLOSS #FOSS #OpenSource #Business #Histogram #ProbabilityDistribution #AlternativeTo #KDE #Students #Researchers #Professionals #SciDavis
▶️ LabPlot - A free OriginPro alternative for #Researchers (Scatter Plots)
▶️ LabPlot - A free OriginPro alternative for #Researchers (Scatter Plots)
Catalyst Nanomaterials Lab has published another video tutorial that shows how to create stunning scatter plots, analyze correlations, and uncover hidden patterns in your data using #LabPlot. Go check it out!
➡️ https://www.youtube.com/watch?v=r1Fv1lAEf2c
\#FreeSoftware #DataAnalysis #DataViz #Research #OriginProAlternative #Science #Tutorial #FLOSS #FOSS #OpenSource #Business #ScatterPlot #Correlation #SciDavis #Students
▶️ LabPlot - A free OriginPro alternative for Researchers (Histogram Plotting)
▶️ LabPlot - A free OriginPro alternative for Researchers (Histogram Plotting)
Catalyst Nanomaterials Lab has published another video tutorial that reveals the secrets of creating stunning histograms in #LabPlot. Go check it out!
➡️ https://www.youtube.com/watch?v=5TGon5QZYic
\#FreeSoftware #DataAnalysis #DataViz #Research #OriginProAlternative #Science #Tutorial #FLOSS #FOSS #OpenSource #Business #Histogram #ProbabilityDistribution #AlternativeTo #KDE
The graying open source community needs fresh blood :opensource: 💉 🩸
The graying open source community needs fresh blood :opensource: 💉 🩸
https://www.theregister.com/2024/07/15/opinion\_open\_source\_attract\_devs/
We agree with the main thesis of the article. And that's one of the reasons why the #LabPlot team strongly supports the idea of mentorship of students and actively participates in such programs as the Season of KDE (SoK) or Google Summer of Code.
\#OpenSource #FOSS #FLOSS #FreeSoftware #Mentorship #KDESoK #GSoC #Development #SoftwareDevelopment #Coding #Leadership #Community #KDE
Labplot gets funding from NLnet to work on:


Labplot gets funding from NLnet to work on: ➡️ Live Data Analysis, ➡️ Python Scripting ➡️ Statistical Analysis
https://labplot.kde.org/2024/07/30/labplot-funded-through-ngio-core-fund/
\#dataanalysis #funding #statistics #data #ngi #Python #opensource #foss #freesoftware #labplot #research #engineering #nlnet
➡️ LabPlot - A free OriginPro alternative for Researchers (Multiple Peak Fit)
➡️ LabPlot - A free OriginPro alternative for Researchers (Multiple Peak Fit)
Catalyst Nanomaterials Lab has published another video tutorial that will show you how to fit multiple peaks in your data using #LabPlot. Go check it out!
https://www.youtube.com/watch?v=Uf34So7DbZI
\#FreeSoftware #DataAnalysis #DataViz #Research #OriginProAlternative #Science #Tutorial #FLOSS #FOSS #OpenSource #Business #BaselineCorrection #Peak #AlternativeTo #SciDavis
➡️ LabPlot - A free OriginPro alternative for Researchers (Baseline Correction)
➡️ LabPlot - A free OriginPro alternative for Researchers (Baseline Correction)
Catalyst Nanomaterials Lab has published another video tutorial that will show you how to Identify and remove unwanted baselines in your data using #LabPlot. Go check it out!
https://www.youtube.com/watch?v=nHczlEeZUZM
\#FreeSoftware #DataAnalysis #DataViz #Research #OriginProAlternative #Science #Tutorial #FLOSS #FOSS #OpenSource #Business #BaselineCorrection #AlternativeTo
➡️ LabPlot - A free OriginPro alternative for Researchers (Tutorial 1 - Download and Installation)
➡️ LabPlot - A free OriginPro alternative for Researchers (Tutorial 1 - Download and Installation)
Catalyst Nanomaterials Lab has published a video tutorial that will guide you through downloading and installing LabPlot on your system. Go check it out!
https://www.youtube.com/watch?v=s6Codrauv0g
\#LabPlot #FreeSoftware #DataAnalysis #DataViz #Research #OriginProAlternative #Science #Tutorial #FLOSS #FOSS #OpenSource #Business #AlternativeTo
The latest release of #LabPlot is here! 🚀 🙂

The latest release of #LabPlot is here! 🚀 🙂
LabPlot 2.11 comes with many new features and improvements in various areas.
Go get it! ➡️ https://labplot.kde.org/download/
Read more about the release here: ➡️ https://labplot.kde.org/2024/07/16/labplot-2-11-released/
\#DataAnalysis #DataScience #Analytics #Data #DataAnalytics #DataViz #DataVisualization #Science #Statistics #Mathematics #FOSS #FLOSS #OpenSource #KDE #Education #Business #SciDAViS
Easy work with a #TriangularDistribution is now possible in #LabPlot .
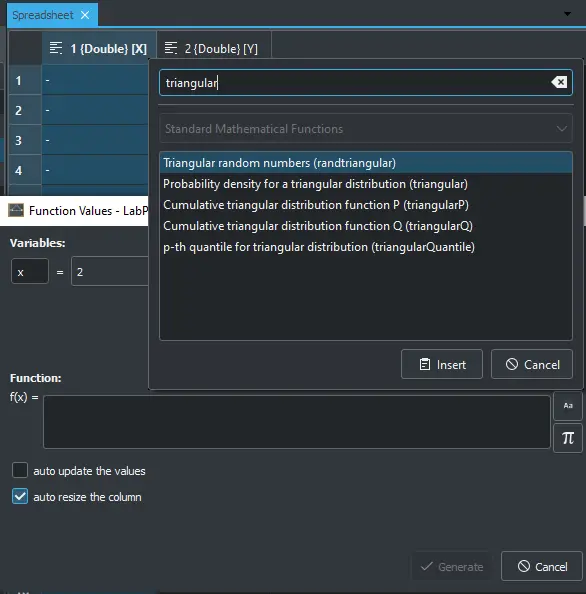
Easy work with a #TriangularDistribution is now possible in #LabPlot [dev].
Here are some of the most common applications of the triangular distribution:
▶️ Business and economic simulations ▶️ Risk analysis ▶️ Natural phenomena modeling ▶️ Decision-making ▶️ Manufacturing and quality control
\#Business #Risk #DataAnalysis #Simulation #DataAnalysis #DataScience #Statistics #FOSS #OpenSource #Analytics #Projects #Math #Education
@[email protected] @[email protected] @kde That's a good question, seems to be a hard topic within KDE.
#LabPlot is now also fully available in Ukrainian and French! Thank you ❤️🙂
The following translations still need some work... And other languages need a bit more work 😉
@[email protected] @[email protected] Not meaning to be rude; but then again, what's the point of not using Continuous Localization á la Weblate or Crowdin in 2024 again?
Since July you can enjoy the new 2.11.1 version of #LabPlot, an open-source data analysis and visualization software.
Check your current version and ask your package maintainer to provide the latest version for your #Linux and #FreeBSD distribution.
➡️ https://repology.org/project/labplot/versions
#DataAnalysis #Statistics #Research #Ubuntu #LinuxMint #ArchLinux #Slackware #Debian #Fedora #OpenSUSE #RedHat #HaikuOS #GNU #CentOS #FreeSoftware #OpenSource #Manjaro #Zorin #FOSS #FLOSS #KDE
@maulanahirzan @[email protected]
Thank you for sharing your opinion. We love to hear that you enjoy using #LabPlot. We invite you to also subscribe to our LabPlot YouTube channel.
@maulanahirzan @[email protected]
Thank you for sharing your opinion. We love to hear that you enjoy using LabPlot. We invite you to also subscribe to our LabPlot YouTube channel.
@[email protected] @[email protected] I always using LabPlot to make a graph. The customization is so detailed
@[email protected] @[email protected] I love this practical interpretation of the empirical method. It can be quite hard to remain objective while your brain is grasping for familiar narratives! I find curiosity is a great way to resolve the cognitive dissonance.
14/ The last of Paul F. Velleman's aphorisms refers to the value of conflicting explanations.
#DataAnalysis #DataScience #Analytics #Data #DataAnalytics #DataViz #DataVisualization #Science #Statistics #Math #STEM #FOSS #OpenSource #KDE #Education #Business #LabPlot
@[email protected] @[email protected] nice! 👍
13/ Another of Paul F. Velleman's aphorisms is related to the co-evolution of different aspects of data analysis.
➡️ The data analysis process rarely proceeds in an orderly march from question to answer.
➡️ Software that requires us to know the question before we can seek answers hinders real data analysis.
#DataAnalysis #DataScience #Analytics #Data #DataAnalytics #DataViz #DataVisualization #Science #Statistics #Math #STEM #FOSS #OpenSource #KDE #Education #Business #LabPlot
Thank you for your kind comment 🙂
@[email protected] @[email protected] the labplot icon is sooo good.
12/ Another of Paul F. Velleman's aphorisms, this time on the importance of data visualisations.
#DataAnalysis #DataScience #Analytics #Data #DataAnalytics #DataViz #DataVisualization #Science #Statistics #Mathematics #Math #STEM #FOSS #FLOSS #OpenSource #KDE #Education #Business #EdwardTufte #LabPlot
11/ It's time for the next of Paul F. Velleman's Aphorisms for Data Analysis:
#Aphorism #DataAnalysis #DataScience #Data #Outlier #DataViz #Science #Statistics #Mathematics #Math #STEM #FOSS #FLOSS #OpenSource #LabPlot
@silmaril Thank you for your feedback! And let us reiterate here that any help would be greatly appreciated 🙂
@silmaril "system version" is the version that was used by your system/distribution to link cantor against. We'll re-phrase this part to make it more clear until we have a better and more flexible solution in place.
Yes, showing the version should be possible in the settings dialog. We added this point to our TODO-list.
Would it be possible to display the Python version and/or it's executable path in the CAS configuration dialog?
That's where I would look for this information and it wouldn't leave any potential for documentation not being up to date.
The FAQ currently states:
On Linux distributions it usually means LabPlot only works with the system version of Python.
What is the "system version"?
On my system python3 --version returns Python 3.10.12, but print(sys.version) in LabPlot returns 3.11.9 (main, Nov 10 2011, 15:00:00) [GCC 13.2.0]
The information about Python versions on Windows seems to be correct, but I would recommend to mention the LabPlot version we are talking about in the FAQ, since this will probably change in future versions.
@silmaril this is correct at the moment. Clearly, this not what people want to have usually and we need to change this.
To determine the required version, you can check the dependencies of executable ‘cantor_pyrhonserver’ on Linux either in your package manager or with ldd. For windows we compile and ship everything and document the required version of python in our FAQ.

