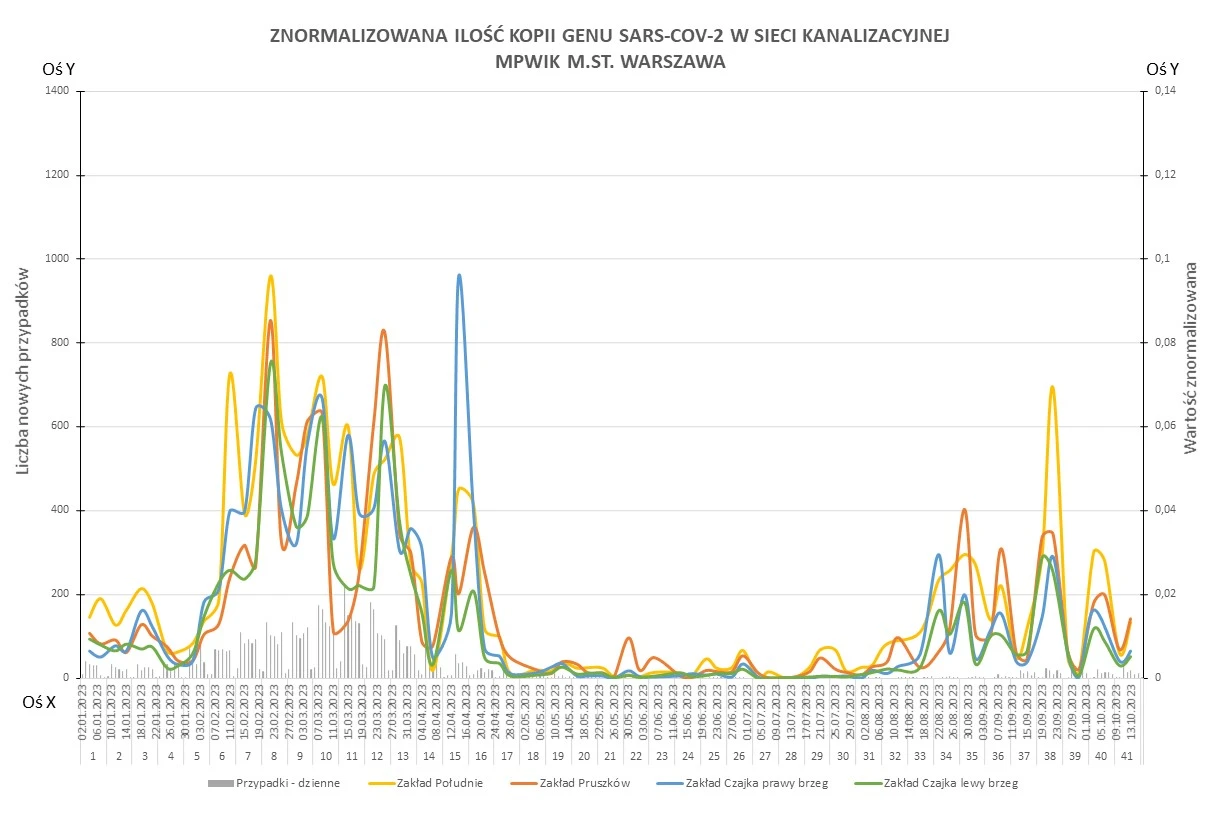
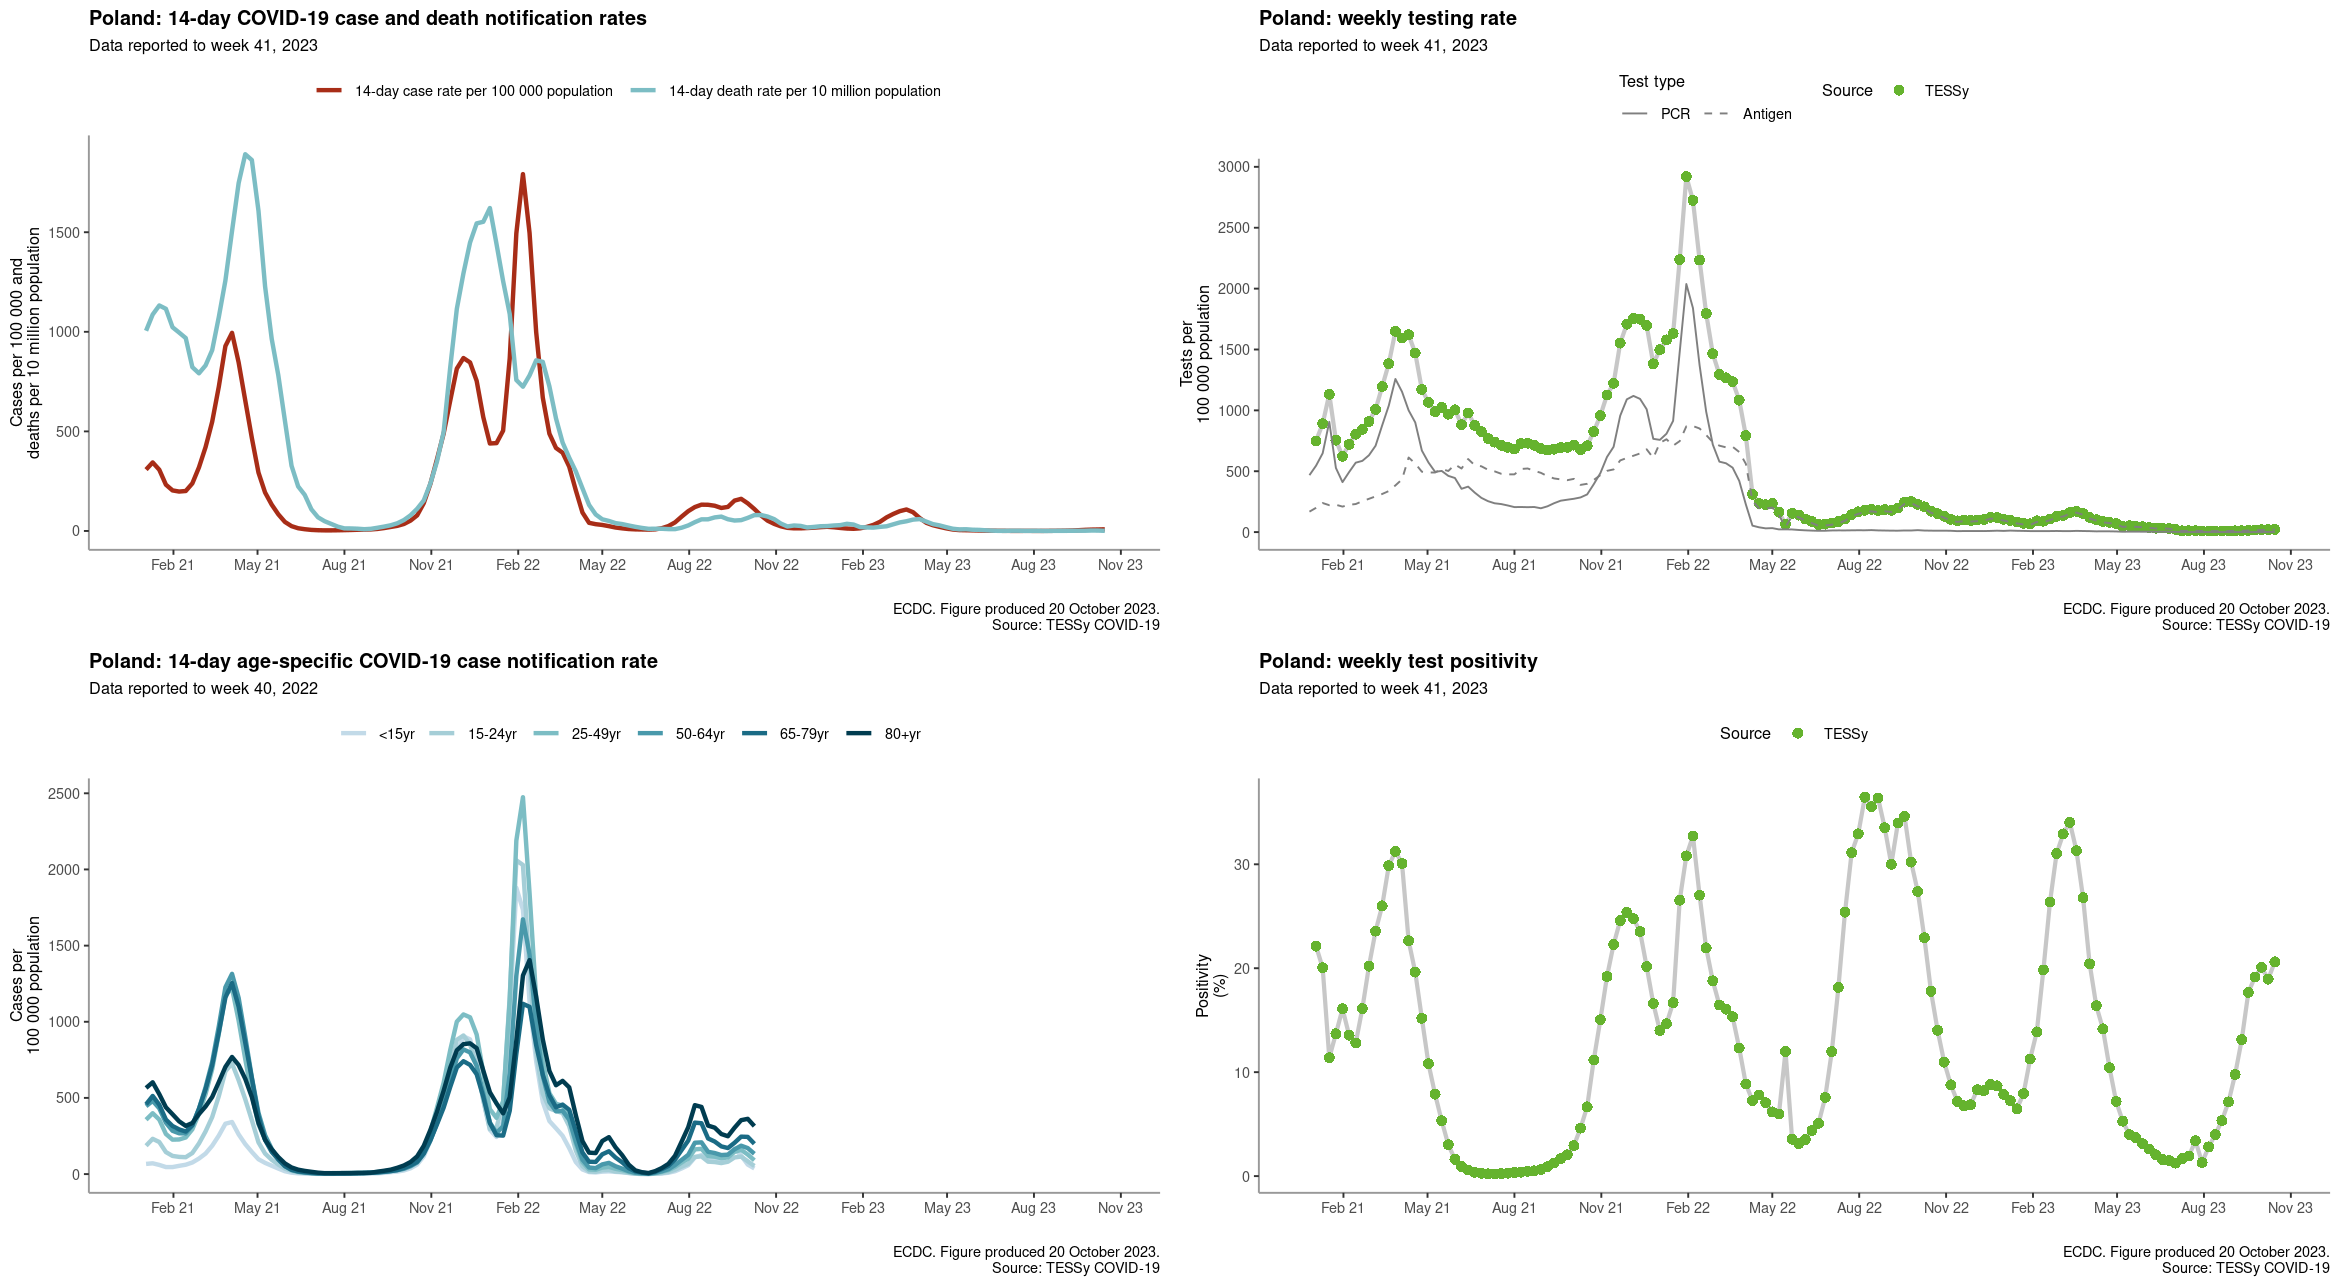
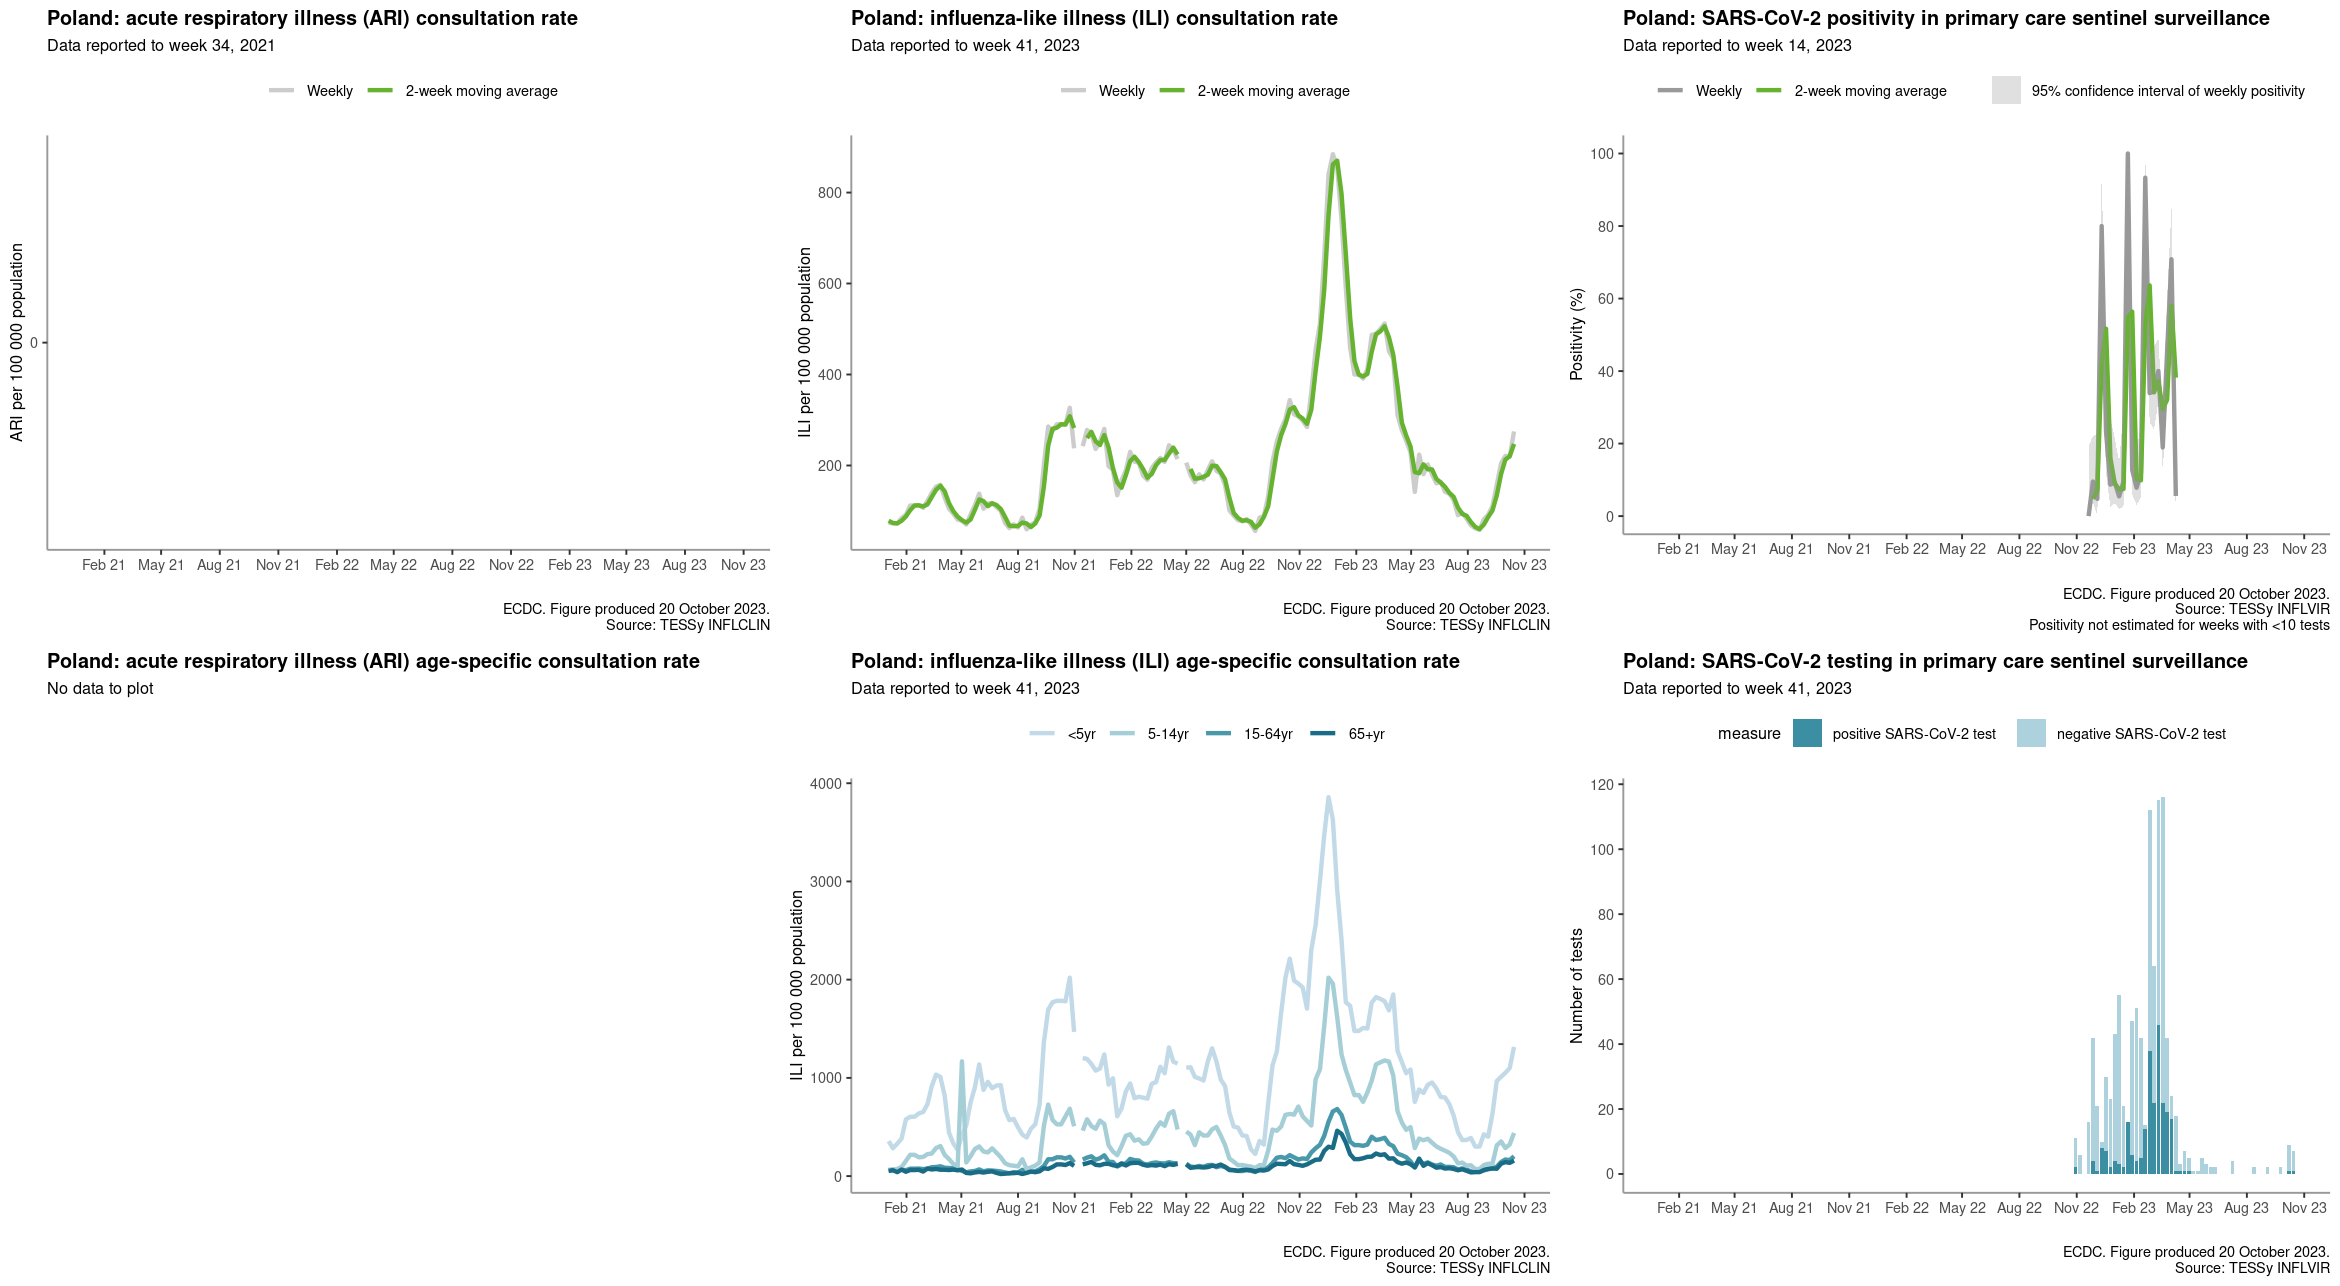
Wykres SARS-Cov2 w warszawskich ściekach [2023-10-23] + tygodniowe dane o testach i zakażeniach z ECDC
Wykres SARS-Cov2 w warszawskich ściekach [2023-10-23] + tygodniowe dane o testach i zakażeniach z ECDC


cross-posted from: https://szmer.info/post/1222692
Fala jednak jeszcze nie maleje ale chwilowo wygląda na wypłaszczoną 1-2 tygodnie temu. Niestety dane o hospitalizacjach w P*lsce nie istnieją ale np w Kanadize osiągnęły dość wysoki poziom np taki jak w czasach Delty. Oczywiście dzisiaj nawet hospitalizacje mają zazwyczaj znacznie łągodniejszy i krótszy przebieg więc samo porównywanie liczb to za mało.
Testujemy mało i na wykresie tego nie widać, ale niecałe 3 razy częściej niż na samym początku wzrostów na początku sierpnia, w październiku robiąc zawrotne 8500 testów tygodniowo..
By the end of week 41 (ending 15 October 2023), rates of respiratory illness (influenza-like illness (ILI) and/or acute respiratory infection (ARI)) in the community were at expected levels for this time of the year in most EU/EEA countries and were driven in part by SARS-CoV-2 transmission. Increases in case counts continued to be reported, most notably among older age groups. This has translated into sustained increases in hospital or ICU admissions and deaths in some EU/EEA countries.
Recent increases in SARS-CoV-2 detections pooled at the EU/EEA level have peaked, although half of the 18 countries reporting age-specific data continue to observe increases compared to the previous week among people aged 65 years and above; these trends for SARS-CoV-2 have continued as long as 13 weeks in some countries. As the oldest age groups have the highest risk of severe disease, these figures highlight the importance of continuing to monitor disease and implement protective measures in older age groups.


![Wykres SARS-Cov2 w warszawskich ściekach [2023-10-23] + tygodniowe dane o testach i zakażeniach z ECDC](https://szmer.info/pictrs/image/5775e52f-2136-4941-9264-6bdc895cf1f9.jpeg?format=webp&thumbnail=196)
![Wykres SARS-Cov2 w warszawskich ściekach [2023-10-23] + tygodniowe dane o testach i zakażeniach z ECDC](https://szmer.info/pictrs/image/f9b76b45-2609-49c9-8f5f-7022f7472b40.jpeg?format=webp&thumbnail=196)